By Michael Risse, VP/CMO at Seeq Corporation
Recently I wrote about the explosion of interest and innovation in time-series data storage offerings,
including historians, open source and data-lake options, and cloud-based services. The plethora of choices ensures industrial-manufacturing customers will find a data-management option that fits their needs. Whatever the priorities—data governance, data consolidation, security, analytics or a cloud-first initiative—customers will have many good choices for where to store data.
At the same time, if an organization is planning to consolidate their manufacturing data in an enterprise historian or data lake, they may find they do not accrue the same benefits as they do with other data types. In fact, if they use expectations based on experience with relational data as a justification for aggregating their manufacturing data, they will be disappointed with the results. With some types of data, consolidation in a single system provides advantages for analytics and insights as compared to distributed data sets, but it’s not the same with time-series data. Whether it’s a data historian, lake, platform, pond, puddle or silo—time-series data won’t necessarily yield better insights just because it’s all in one place.
To understand this, let’s consider scenarios where centralizing data does benefit the user—relational data, for example. Relational data has keys that work as handles to the data, i.e. tables, fields and column names, so aggregating or centralizing data yields more possible relationships among the tables, fields, and databases. This isn’t new; business intelligence solutions (Cognos, PowerBuilder, etc.) gained significant traction with this approach starting in the 1990’s. Today, data storage is so inexpensive vendors can offer platforms providing “any to any” indexes, enabling complete self-service for a business analyst.
Another example is platforms that index all data contained within a semi-structured data set—think web pages, machine logs, and various forms of “digital exhaust.” Two variations of this approach are used by Google and “document” NoSQL databases such as MongoDB. The idea is the structure of the data doesn’t have to be consistent or defined in advance as in a relational table. Instead, a schema is overlaid on the fly, or after the fact, which enables the user to work with any “handle” created by the index. Again, this means that the more data is centralized and indexed, the better. Users get to see more insights across larger data sets and the data is pre-indexed or organized and ready to work.
Keep your data where it is
With structured (relational) and semi-structured (log files, web pages) strategies as success stories for centralizing data, it’s easy to see why one could assume consolidating time-series data into one place might yield equal benefits to end users, but it doesn’t. IT-centric data solutions may try to convince themselves their centralization models apply to time-series data, but they fail like trying to climb a greasy flagpole: it doesn’t work without handles.
Why is this? Time-series data simply doesn’t lend itself to pre-processing the way structured data (relationships) or semi-structured data (indexes) does. There are no “handles” in a time-series signal, so there is no way to add value in pre-processing the data for analytics. This is a key issue for engineers working with the data as they have to (at the time they do their analysis) find a way to integrate “What am I measuring” (the sensor data) with “What am I doing” (what an asset or process is doing at the time) and even “What part of the data is important to me?”
Creating context
As an example of the challenges in working with time-series data, let’s consider a simple time-series data set that has sensor data recorded every second for a year, or 3.6M samples, in the form timestamp:value.
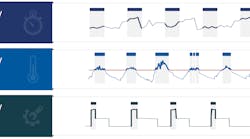
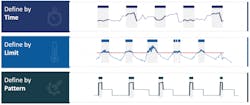
Most likely, the user doesn’t want all the signal data for their analysis; instead they want to identify time periods of interest “within” the signal. For example, perhaps the user needs handles to periods of time within the data for analysis defined by:
- Time period, such as by day, by shift, by Tuesdays, by weekdays vs. weekends, etc.
- Asset state: on, off, warm up, shutdown, etc.
- A calculation: time periods when the 2nd derivative of moving average is negative
- Context in a manufacturing application like an MES, such as when plant or process line is creating a certain product
- Data from a business application, for example when energy price is greater than x
- A multi-dimensional combination of any or all of these time periods of interest (like where they overlap, or where they don’t)
- An event, for example if a user wants to see data for the 90-minute period prior to an alarm
In other words, time periods of interest are when a defined condition is true, and the rest of the data can be ignored for the analysis.
The ability to define the time periods of interest within a signal based on any type of criteria is a critical “analytics time” component of working with time-series data.
Two comments on this example. First, even with a simple example of one year of data from one signal, it’s obvious there are an infinite number of ways the signal might be sliced or consumed for analytics purposes. And, since there are so many possible options, the actual choosing of the time periods of interest can only be done at “analytics time” when the user’s intent is clear and the relevant time segments may be identified. In addition, this example is just one signal. Imagine production environments of 20,000 to 70,000 signals such as pharmaceutical or chemical plants, oil refineries with 100,000 signals, or enterprise roll-ups of sensor data that include millions of signals.
Second, while the examples above use the term “defined by” to describe the time periods of interest, we can also call this “contextualization.” Generally, industry use of contextualization is when data is merged from different data sources, like a Batch system, signal, and quality metric coming together in a data model. But in the examples above, the context can come from anywhere: a measurement, another application, or simply the user’s expertise and intuition.
Contextualization, at “analytics time” and in the hands of the engineer, is what transforms time-series data from a squiggly line in a control chart into data objects of interest for analysis, and all of its forms should be included in its definition.
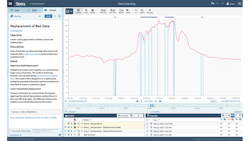
In Seeq, an advanced analytics application, time periods of interest are “Capsules” and marked by colored bars at the top of the trending pane. In this case they denote areas that need to be addressed in a data-cleansing effort.
Finally, it is important to remember that any analysis of time-series data involves sampling of analog signals with strict adherence to the challenges of interpolation and calculus, something that IT-data consolidation/aggregation efforts typically don’t address. The ability to align signals with different sample rates from different data sources in different time zones spanning daylight savings time or other changes is an absolute requirement prior to enabling the defining of the relevant time periods.
Exceptions to the rule
There are possible exceptions to “analytics time” context, because dynamic contextualization is not always a requirement for some work products. A standard report or KPI, such as a weekly status summary or OEE score, has the time periods of interest defined in advance and then used repeatedly in the analysis.
On the other hand, if it’s an ad hoc investigation such as root-cause analysis or understanding variation in a quality metric, then only engineers at “analytics time,” when they are doing the work, will be able to define the data dimensions required for analysis.
Knowing what you are looking for in advance, or not, is the difference between fixed reporting solutions using static definitions of time periods (even if they provide a drop-down selection of time ranges, it’s still defined in advance)—and high-value dynamic, ad hoc, analytics and investigation efforts.
Process expertise is required to create context
One outcome of the need for analytics-time contextualization is many data scientists start at a disadvantage when working with time-series data. This is because they can’t run their algorithms until the data is modeled, which means focusing or contextualizing the data they are working with first. But who knows the time periods of interest and relevant contextual relationships needed for a particular analysis? The engineer. The experience, expertise and ability to define the relevant data for investigations and analyses are all in the same person.
Data-analytics software should allow engineers and other process experts to interact directly with data of interest to define time periods and relevant contextual relationships.
Contextualization—and the engineers who understand the assets and processes—is therefore imperative to time-series analytics regardless of the data-management strategy. Only the engineer, who alone has the expertise and understands the needs of their analysis, will know what they are looking for right at the time of investigation. This includes the ability to rapidly define, assemble and work with the time periods of interest within time-series data, including access to related data in manufacturing, business, lab and other systems.
Conclusion
There is ever more attention and pressure on digital transformation and the required IT/OT integration necessary to provide an integrated view across business and production data sets. Therefore, it’s going to be increasingly important for IT and manufacturing organizations to recognize the importance of contextualization regardless of storage strategy in working with time-series data.
The engineer who knows what they are looking for, and can ask for it at “analytics time,” is going to define and enable the advanced analytics and insights that are the focus of smart industry and Industry 4.0 investments. Therefore, organizations that align the contextualization requirements of time-series analytics with their data strategy will have a higher chance of improving production outcomes through insights.
The location of the data—in a historian or many historians, in a data lake, on premise or in the cloud—isn’t going to change the required analytics effort. There are great reasons and offerings for data storage and consolidation, on premise and in the cloud, but the priority for insight is accelerating the expertise of process engineers and experts.
Behind the Bio
Seeq is an advanced analytics application for time-series data and is fortunate to work with the leading vendors of time series management and storage offerings: data historians, data lakes, open source offerings, either on premise or in the cloud.


