Case Study: MachineMetrics provides real-time production data

by Graham Immerman, director of marketing with MachineMetrics
The Case Study
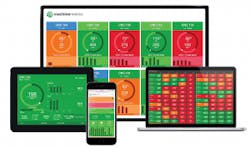
MachineMetrics is an IIoT-analytics platform that monitors production in real-time, providing visualizations of real-time production data, instant notifications and predictive capabilities that help identify production bottlenecks, measure process improvements and drive manufacturing efficiency.
The Solution
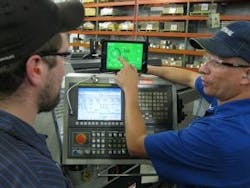
Fastenal installed the MachineMetrics platform to collect production data from machine controls and machine operators for the entire production floor and used this data to monitor machine conditions and track the progress of jobs via OEE production efficiency. Real-time dashboards mounted on the production floor provided an at-a-glance indication if jobs were performing at or below expectations, enabling enhanced job-scheduling. Operator touchscreens were mounted at each machine, empowering operators to meet production goals and track machine setup/downtime. Analytics reporting enabled managers to not only track efficiency and quickly identify production bottlenecks related to specific machining operations, but also helped measure the effect of process improvements. MachineMetrics’ open APIs enabled data-aggregation across shop-wide systems, along with the ability to build custom applications, dashboards and analytics.
Here see an interview with Fastenal’s Tim Borkowski (VP of manufacturing), Joe Garteski (operations manager) and Matthew Nelson (manufacturing engineer).
What challenges were you trying to solve by implementing a machine-monitoring system?
Tim: I think the biggest thing we were looking for when first considering an implementation like this was to find something that was a good fit our company and our process. Previously, we had used a competitive software, and at the time they had the DNC side covered. The software was a bit clunky, and we needed something more user friendly. If you wanted information it was rather difficult to get from the reporting side of the software. The truth is technology has changed, and with the variation of controls on our more modern machines our monitoring needs changed as well. The fact is we are transitioning from a job shop. When we had smaller quantities, it was harder for us to track information. It felt like we were shoveling sand; throwing it over our shoulder repeatedly and never looking back. Now, our quantities are going up, and we have the ability to look at our process control and make impactful improvements. We need to know our spindle time and how it’s going 24/7.
Joe: One of the main issues we faced was determining options when there wasn’t enough management. We wanted to know what happens from first shift, to second shift to the weekend. What happened between those shifts? Was there any variation in productivity? If so, why? Why was that machine sitting idle? Was the machine down that day? Were there more setups that day?
Another challenge was the lack of real time information. Having to wait for an individual to come back from that shift to gather specifics on various issues was very frustrating. Sometimes we would have to wait 16 hours before an operator came back on shift to speak with them to understand why a machine was down or why a specific fault occurred. Was there an issue with tooling? These are the things that we want to determine but didn’t have a solution for; it all leads to how to keep the machines up more.
Matthew: We started out using MachineMetrics to monitor 11 Swiss machines and three TTs. Since then, we have added more machines, and we’ll certainly be adding more. We installed the monitors on our shop floors so that everyone can know what’s going on, including operators and managers. We also put the tablets in right away so we could start gathering feedback from the operators.
Joe: As we were discussing different systems, what immediately caught our eye from MachineMetrics was the simplicity of use and the availability of real-time information. Getting the data out of our previous system wasn’t easy, and the dashboards weren’t especially legible. That was what started us on MachineMetrics. There was no clutter. The ease of reporting was a huge factor. Our previous system was just barcodes, whereas MachineMetrics visualizes the data in a way that makes it so easy to use, it’s just plug and play.
Tim: Another differentiator was their flexibility, and their responsiveness. Everyone we had talked to was shying away from all the various unique job numbers and part numbers. We’re pushing 2,500-3,000 jobs per month. Some systems couldn’t handle that. Not only this, but we also couldn’t pull that data from their platforms. MachineMetrics stepped up to the plate and was able to provide that over their competitors and a lot more.
Matthew: They were willing to work with us and wanted our input. From design to charting to data visualization, they were willing to implement changes we requested on the fly to their software, sometimes even within 15 minutes of our request. They personally worked with our team to make sure their platform was a perfect fit for what we needed. We had constant access to their developers for easy changes, and they were even willing to take on difficult changes as well. They listen and learn from us, just like we do with our own process. Every time we come up with a new idea, we call the MachineMetrics team. Just the other day I called and asked to see what type of jobs that quality issues correlated with. Our customer success manager had gone back to the development team with that issue and within just a few hours she called us back and told us to refresh our screen: the information I needed was there.
How did MachineMetrics solve your specific challenges? What qualitative and quantitative impact has MachineMetrics had on Fastenal?
Tim: Thanks to MachineMetrics there’s more transparency in our process. Now, when issues arise managers can actually try to help solve them in a more proactive way. I don’t have to wait 16 hours anymore to find out when and why issues happen. I’m able to see things beforehand, speak with that individual, and implement those changes so we can be more efficient.
Matthew: There’s a channel of accountability. I did a lot of the training for MachineMetrics. The operators have a gut reaction that says “Oh great now you are looking over my shoulder even more”. But the truth is if there’s something going on, the manager would probably be on them (the operator) about it anyway. This gives them the opportunity to be involved in that process. If we don’t know what’s causing the issue, it makes it impossible to create a plan to fix it. MachineMetrics allows us to engage our brains in a different way. Operators and managers can look at historical data and implement it into the future. Now, when we have an issue with a job, we can apply what we’ve learned from this mistake to the next time. We no longer have to be reactive.
Joe: Furthermore, the operators now do everything they can to keep the monitors green. They became less worried about us looking over their shoulder and more focused on their own success. They’ve become more success driven.
Tim: As far as the problem-solving aspect goes, we’ve found really that the only downside of MachineMetrics is that it doesn’t produce actual operators. It’s made it so glaringly obvious where we need more personnel and where we can add more productivity. It shows us how our average order size dictates our utilization of our equipment. We’re producing more parts now and it’s become clear where we need to add resources. But, the big thing that we drill into a lot is the cycle times. MachineMetrics does an amazing job breaking down cycle times; now we can have a very structured routing time so we can quote jobs more accurately. How close are cycle times to quoting times? Are we even close? Having this information right in front of the operator allows them to improve their performance.
There are jobs that we quoted out at 45 seconds, and it turned out to be a 30 second part. And vice versa. Having the ability to see every second of each cycle times is so impactful for us. Most manufacturers claim how great their lean practices are, but 6S is all about visualization. Using the tablets and monitors, visualizing the status for each of our machines, is imperative to our lean success. You can see the color of the tiles and you know exactly where that machine is at. With downtime, we have colored pins that show exactly which shifts/operators are working where and when. Using MachineMetrics, we can easily justify adding headcount to a job when it’s necessary. Thanks to the tablets, we can attribute machine downtime to specific reasons and know for sure why they’ve occurred. There’s no more educated guessing or finger-pointing. There’s a solid reason behind everything and every decision we make. We don’t have to worry about fuzzy memories or rely on anything other than the data. The historical data speaks for itself.
Joe: When we started monitoring, we thought our utilization was far better than it really was. You talk to the production manager and he says, “Well, those machines are always running.” Thanks to MachineMetrics we now know that we were only up 39% of the time, and we have that hard data to say, “Hey, the data says something else.” Data is history. We can’t change history. We can plan for it but we can’t change what’s already happened. With the MachineMetrics system, the information is right there. It’s amazing for when we have tours as well. Showing off the software that helps and improves our process demonstrates our commitment to excellence.
The Future
Since the initial pilot of MachineMetrics, Fastenal expanded their implementation by integrating more machines and more equipment. While at first Fastenal was using MachineMetrics to monitor just their turning centers, they are now looking at their high-production vertical machines as well to determine median cycle times. This expansion also includes additional Fastenal production sites as the success experienced at Fastenal’s Winona plant has caught the attention of managers from other Fastenal locations.
Tim: Within the process-improvement side of things, we look at downtime reasons and quality reasons, and the more time we spend on this, the more we can use our continuous improvement processes. Finding what is broken in our system is essential to lean improvement, and MachineMetrics gives us that starting point to do exactly that.
Matthew: Technology changes all the time. The interesting thing for me is to work with MachineMetrics into the future on some of our more complicated projects, like manual machines. How many times do they cycle in a given period? We’ve always had infrared barometers, and we’ve always taken shots of them. Being able to control that process, and understand our set up time in between those jobs will be so valuable. We also do a lot of safety critical applications and having better visualization into those will be incredibly helpful as well. In the three months since implementing MachineMetrics, we ran 305 hours faster than the previous three months. At this rate, we have been able to boost production by over 100 hours each month. It is the same as adding two and a half weeks to each month.