Best practices for leveraging dashboards to visualize plant floor data

The phrases “Industry 4.0” and “Fourth Industrial Revolution” are overused and overhyped.
Some companies even promise that huge investments in collecting all the data will “transform” the entire manufacturing enterprise. This article does not explore sophisticated AI platforms that connect to and analyze multiple complex systems. A better place to start is: I can connect some of my machines—now what do I do with the data?
Some practical examples have been proven to increase productivity, reduce risk, and maximize profitability. For example:
- It is standard in wastewater-treatment plants to monitor flows to ensure that an overflow does not pollute the environment and risk costly fines to a municipality. These are typically trend graphs on an HMI (human-machine interface), SCADA (supervisory control and data acquisition) system, or even a log to a database.
- In production plants, the current drawn by motors is important data to track and have visible. A high current will often signify something physically wrong—a failed hydraulic fluid pump, a gearbox with insufficient lubrication, or a failure in the three-phase power to the motor.
- A map of all the machines in a particular department can show running status: green if operating normally, yellow if running, and red (down) if faults are detected.
Collecting too much data without proper analysis is a tremendous waste of resources
There is no standard checklist for data collection. Often, what happens in real life is that when data is collected and analyzed—and the volume and content of data are determined to have relevance—a “dashboard” is created. Here's an example:
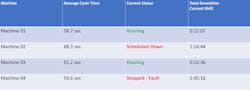
Dashboard data sample. [Image courtesy of Motion]
Generally, before programmable logic controllers (PLCs), distributed control systems (DCSs) or proprietary electronic circuit-board control existed, the information from machines was taken manually by someone with a clipboard. After that, a data-entry clerk often entered a program on a mainframe or primitive non-networked PC. The ability to get the data has always been there, but it was often laborious and time-consuming. With more sophisticated PLCs, better communications protocols, improved HMI and SCADA systems, and edge computers with IIoT (Industrial Internet of Things) capability, suddenly more data was available. Oftentimes, there was too much data.
Management likes seeing dashboards, but are they measuring the right things?
Given the ability to quickly create a dashboard, the danger is that managers will often state, “This will be our dashboard, and this is how we are going to run our operation?” The risk of this tendency is that thousands of dollars can be spent collecting data that does not reduce costs, increase productivity, or lessen risk. Even before cloud computing, you could find stories of sophisticated operator interfaces with 50+ downtime codes to select every time a machine went down. There was a definite and clear productivity drop with complicated requirements.
Lag indicators vs. lead indicators in metrics
However, this is not an argument against a dashboard/scoreboard. Keeping track of the right key performance indicators (KPIs) is crucial; the “score” is another way to put it. The trick is to keep track of the right score. The book “The Four Disciplines of Execution” (Chesney, Covey, Huling) states that “the third discipline is to make sure everyone always knows the score, so that they can tell whether they are winning.” This book introduces the concept of lead and lag indicators. If you display a lag indicator, which employees can do nothing about, that information is ineffective.
Tracking the building blocks and technology for collecting data
Suppose you are talking to someone from an organization who can assist you—for example, a systems integrator, specialized high-tech distributor, or consultant. It is crucial that when you discuss all the system nuances, you are not “pitched” a one-size-fits-all solution. Usually, it takes a team of specialists who can talk to the critical people in your organization. Here is a starting checklist of things to consider:
- Will my existing operation’s PLCs and machines need to be altered to collect data?
- Will I need to use a supplemental network (Ethernet or wireless) to facilitate data collection?
- Can we leverage our existing HMI panels or SCADA software to get information?
- Will remote connectivity by plants and offices in different geographical areas be needed?
- Do we already have integration with cloud platforms such as AWS (Amazon Web Services) or Microsoft Azure?
- Does information need to be transferred to our own ERP (enterprise resource planning) software, such as SAP, or connect with other enterprise-level databases?
As always, teamwork and collaboration are the keys to making sound decisions
Because so many people can potentially be involved, some projects never get off the ground. The data to be collected can be complex, and diminishing returns occur when too many individuals vie to have their say in the implementation.
It is wise to start small with just a few machines to be monitored, while using a qualified supplier with experience in this area to create a pilot project as a proof of concept. There are always five or more layers to consider when driving data from sensor to database. A team with different disciplines that meets regularly is necessary to make and implement the projects, so your enterprise is more agile, flexible and profitable in the long run.
By John Kan, connectivity products manager with Motion Ai