Case Study: Through the looking glass and what AGC found there

As the world’s largest glass producer, AGC makes glass for nearly everything from microwave and vehicle windows to skyscrapers and more. As the glass-provider to so many different industries and customers, our production process is vigorous and critical, so we’re always looking for ways to improve it and knew data analysis and deep machine analytics would be key.
Each of our float lines has 1,500 data points, with manufacturing facilities located across the US, Mexico, Brazil, Europe, Asia and Indonesia. One AGC furnace can melt roughly 600 tons of batch per day and can hold up to 1,700 tons of molten glass within its tank. The furnace consumes roughly 120,000 cubic feet of natural gas per hour, reaching temperatures as high as 3,000°F. For the past 15-20 years, it has constantly melted batch 24 hours a day, seven days a week.
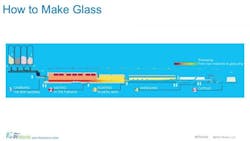
Caption: Flowchart of glass production process from loading the raw material into the furnace to cutting for customer use.
For each furnace, AGC tracks real-time data in its current state, including the glass level, the daily bin weight, the charger speeds, the melter pressure control, and gas flow. We also monitor the power created by assets such as the cooling tower, load chamber, sputter chamber and washer.
Historically, we used OSIsoft’s PI System products such as ProcessBook, DataLink, and Manual Logger to help visualize data from PI historian servers to create reports so we could easily compare plant performance and enable long-term trending. It wasn’t until 2018 when AGC discovered the system could be leveraged to create a data infrastructure that protects, shapes and validates critical data, supports collaboration and increases overall efficiency, performance and quality—while also reducing costs.
We were able to access new tools to analyze multiple processes, such as its sputter coating line, which produces high-efficiency glass through the application of a metallic film added to glass surfaces.
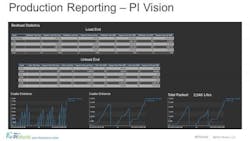
Caption: PI Vision screenshot of an AGC plant sputter coating line to easily compare what was loaded into the coater versus what came out of the coater and further breakdown reporting by machine.
For example, when production-line equipment for the sputter coating line (or any other AGC process) doesn’t perform up to par, operators are made aware of the status and the relative impact on performance and scheduling. However, that's usually where the information stops and underlying causes go unidentified.
To ensure nothing is missed, AGC began using automated email notifications to quickly signal problems with maintenance, helping reduce the amount of downtime and production outage. At the Greenland facility in Church Hill, operators receive preemptive notifications as well, which notifies them when a process is starting to decline so they can take action before it becomes a larger issue.
Trouble-shooting is another use for the tool as well. There was one instance when PI Vision discovered a seven-year trend that was causing the temperature on a melter backwall to slowly increase. We were able to identify the problem, trace the events back to the start, and install countermeasures to verify that the problem had been corrected. If the increasing temperature went unnoticed, we estimate there would have been a two-week downtime that would have cost $2 million.
Before 2018, our IT and OT networks and teams worked separately, but today we’re more integrated and share data in both directions so we can improve both functions.
Going forward, AGC plans to continue exploring additional tools available in PI Vision, with a plan to move progressively toward preventive rather than reactive maintenance.
By Bradley Willson, AGC Glass North America electrical engineer